mViewer
- Description:
- mViewer generates a JPEG image file from a FITS file (or a set of three FITS files in full color). A data range for each image can be defined, and the data can be stretched by any power of the log() function (including zero: linear) or using custom gaussian histogram equalization algorithms. Pseudo-color color tables can be applied in single-image mode.
- mViewer can also generate overlays on the image of coordinate grids, source catalogs (with scaled symbols), image outlings from metadata tables, plus various markers and labels.
- Along with a few other Montage modules, mViewer can be wrapped to support interactive image analysis from Python or through AJAX web interfaces.
- The functionality of mViewer goes beyond what is reasonable to capture in a man page. The user is therefore directed to the mViewer documentation suite.
Examples:
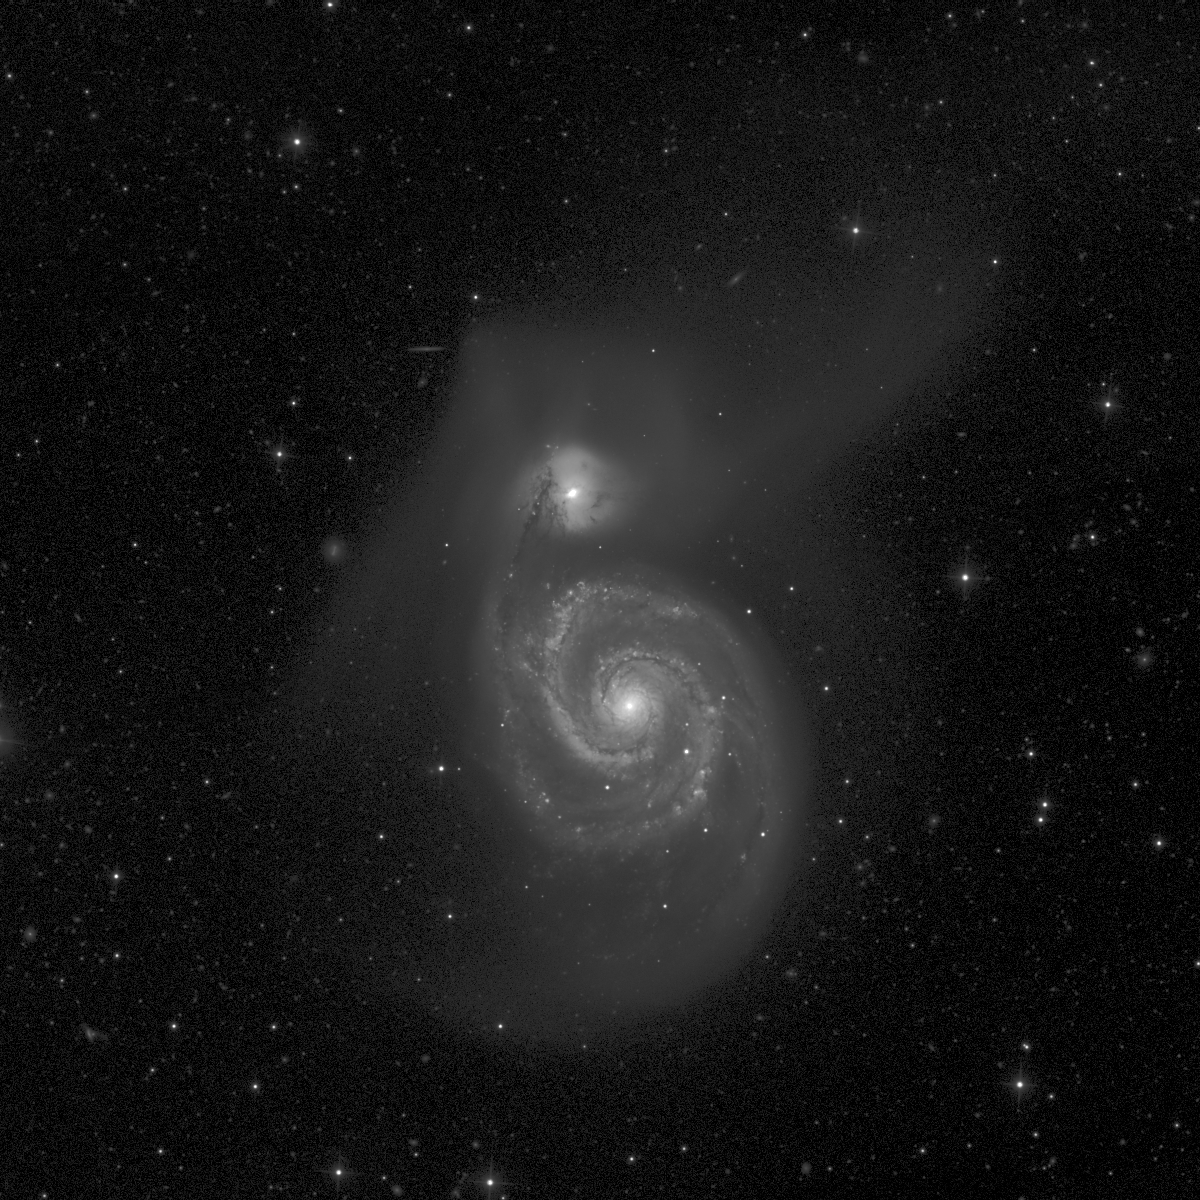
To create a grayscale image from a FITS file:
mViewer -ct 1 -gray SDSS_r.fits -1s max gaussian-log -png SDSS_r.png
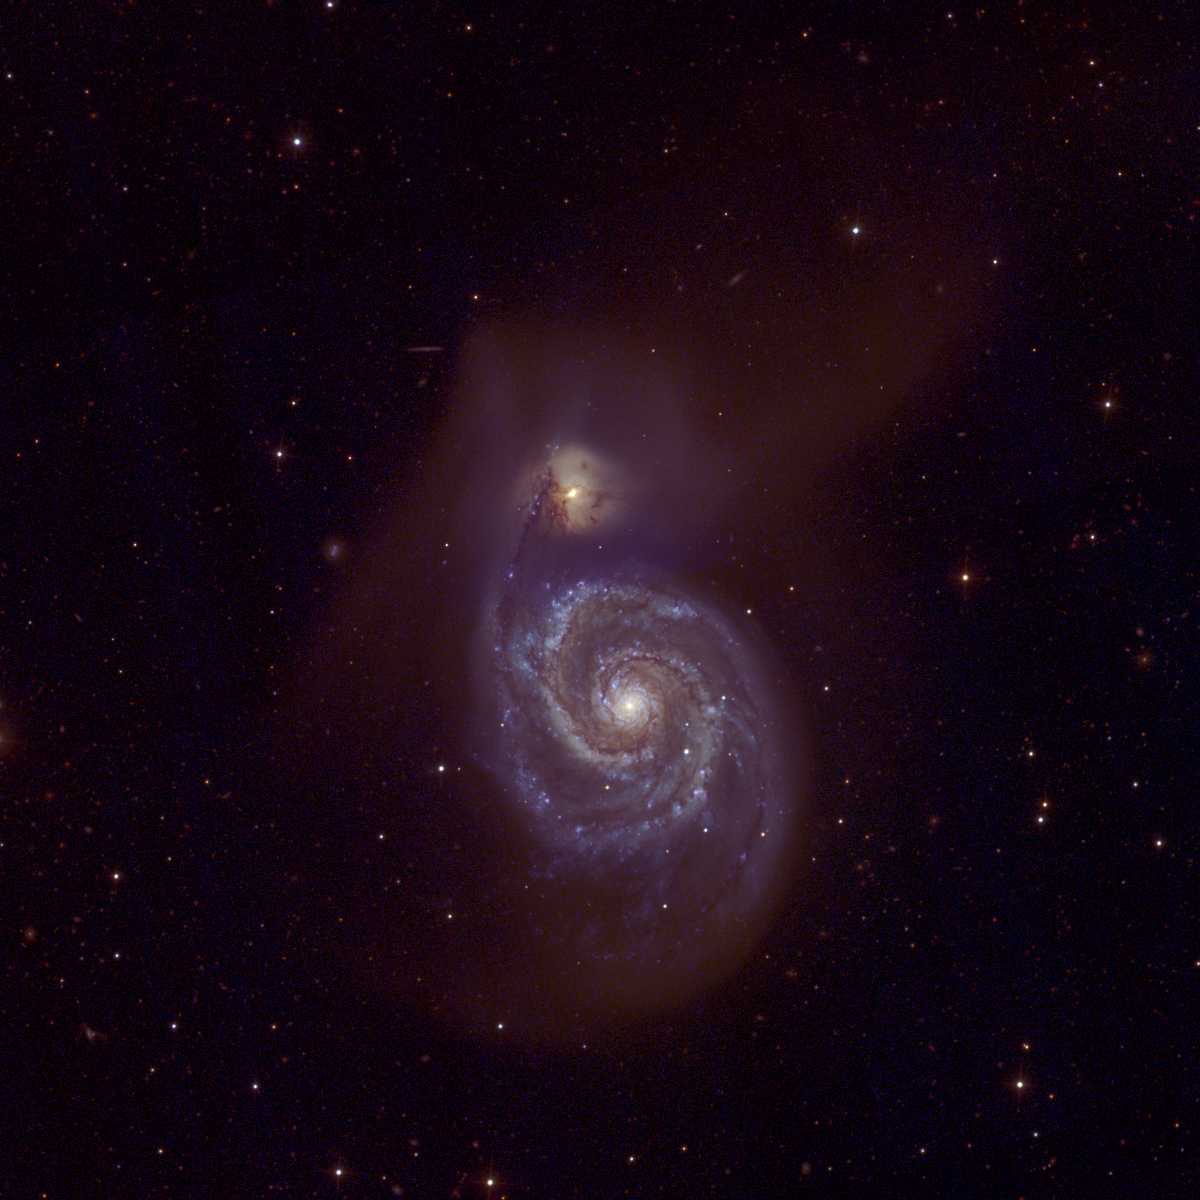
To create a full color image from three co-registered FITS files:
   mViewer \
   -blue     /SDSS_u.fits -0.5s max gaussian-log \
   -green    /SDSS_g.fits -0.5s max gaussian-log \
   -red      /SDSS_r.fits -0.5s max gaussian-log \
   -png      SDSS_Color.png
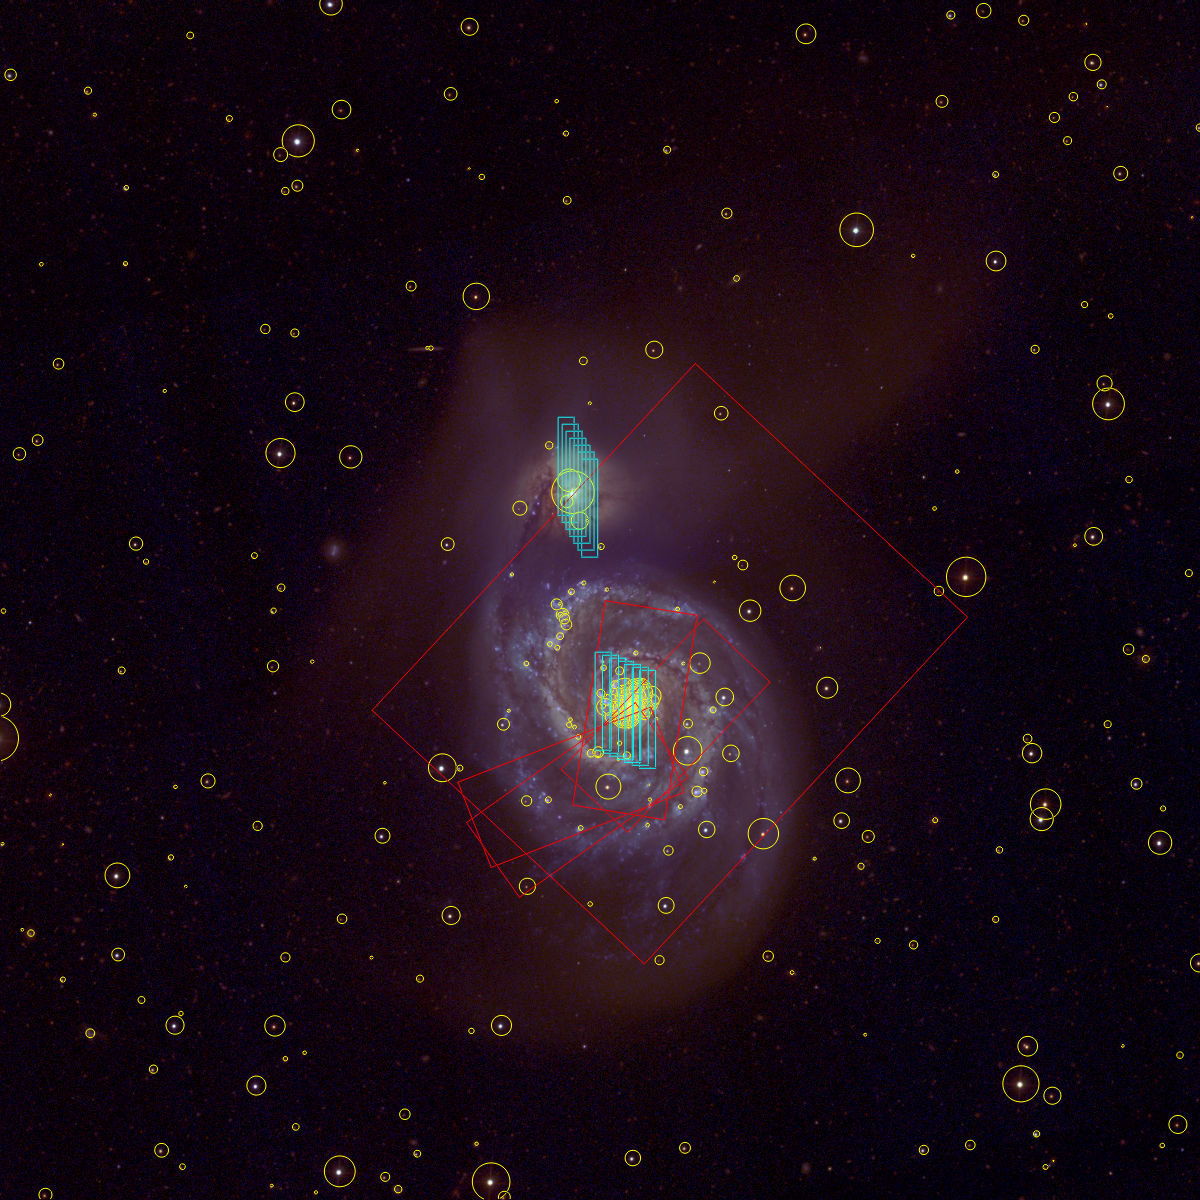
A complex example with a catalog overlay (symbol size, shape and color controled by table columns), image metadata, a coordinate grid and some custom labeling:
   mViewer \
   -color    ffff00 \
   -symbol   1.0 circle \
   -scalecol j_m 16.0 mag \
   -catalog  fp_2mass.tbl \
   -color    red \
   -imginfo  irspeakup.tbl \
   -color    cyan \
   -imginfo  mipssed.tbl \
   -blue     /SDSS_u.fits -0.5s max gaussian-log \
   -green    /SDSS_g.fits -0.5s max gaussian-log \
   -red      /SDSS_r.fits -0.5s max gaussian-log \
   -png      SDSS_ColorOverlays.png