mViewer
- Introduction
- Basic Example
- Grayscale Color Tables
- Full Color
- Overlay Basics
- Table Overlays
- Miscellaneous Directives
- Other Functions
- Cookbook Examples: Stretches and Symbols
- Directive Quick Reference
mViewer and Python (beta)
Python mViewer: Color Tables and Stretching
mViewer provides a dozen pseudo-color tables (reverse grayscale, 'thermal', etc.) and several options for stretching the image. See the mViewer color table examples for more details.
import astroMontage.mViewer as mv

viewer = mv.mViewer()

viewer.set_gray_file("SDSS_g.fits")

viewer.set_color_table(4)
viewer.set_gray_stretch("-0.1s", "max", "gaussian-log")

viewer.init_browser_display()
|
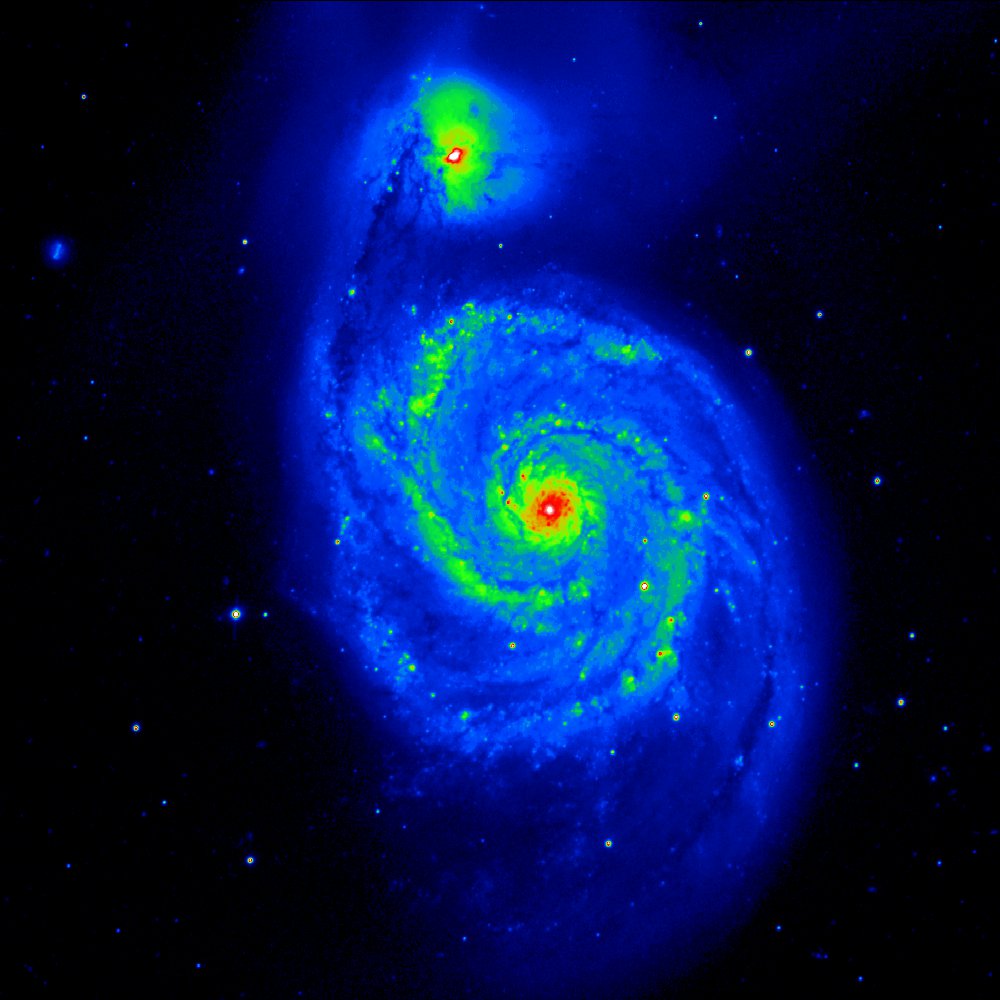
Click image to view full resolution in a new tab. |
The default stretch (used in the previous basic example) is not necessarily the prettiest but is an attempt at maximizing the visual information content. The data is stretched using Gaussian histogram equalization with a logarithmic scaling (so as to show detail at the high end without saturation) and at the low end show down to -1 "sigma". If the image has a large area of essentially black space (not uncommon in astronomical images), the image mean and sigma probably do represent noise and the default stretch will show down into the noise. By moving the lower value up as we have here, the image will look much cleaner.
On the other hand, for some images the "background" (e.g., in the Galactic plane) represents real astrophysical structure and -1 sigma or even -2 sigma is an appropriate stretch.