mViewer
- Introduction
- Basic Example
- Grayscale Color Tables
- Full Color
- Overlay Basics
- Table Overlays
- Miscellaneous Directives
- Other Functions
- Cookbook Examples: Stretches and Symbols
- Directive Quick Reference
mViewer and Python (beta)
Montage Viewer: Introduction
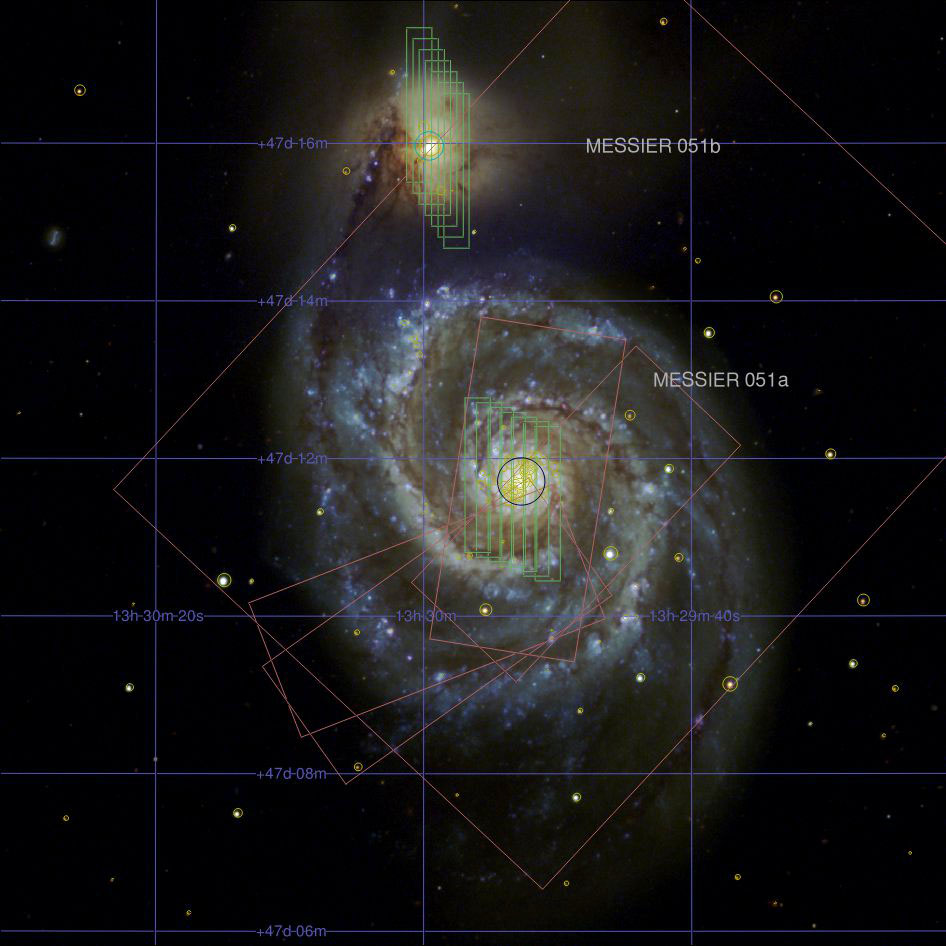
The Montage Viewer, mViewer, is a command line application or visualizing FITS images, overlaying content (grids, symbols., ... ) on them and creating PNG or JPEG files. It can be included in scripts or pipelines. The image of M51 on the left was created with mViewer, with no manual retouching of the image.
mViewer has broad applicability for visualizing astronomical data. The following is a list of of its most useful capabilities:
Click image to view larger version in a new tab. |
|
The low-level mViewer functionality is a stand-alone program suitable for inclusion in scripts or as part of a pipeline. It can also be folded together with Python wrapping code (and a couple of other Montage modules) to support off-line interactive science visualization of astronomical images or with Javascript and CGI wrappers as an interactive web service suitable for sites wanting to allow interaction with their image holdings.