mViewer
- Introduction
- Basic Example
- Grayscale Color Tables
- Full Color
- Overlay Basics
- Table Overlays
- Miscellaneous Directives
- Other Functions
- Cookbook Examples: Stretches and Symbols
- Directive Quick Reference
mViewer and Python (beta)
Montage Viewer and Python
The Montage package provides a broad array of tools for manipulating astronomical images and in particular supports mapping between projections and coordinate systems, background matching within a set of overlapping images, and mosaicking of large numbers of images into a single view. This functionality applies both to single plane images and datacubes.
One of the Montage tools, mViewer, has broad applicability for visualizing astronomical data. For details on mViewer's capabilities, see here. The low-level mViewer functionality is a stand-alone program suitable for inclusion in scripts or as part of a pipeline. It can also be folded together with Python wrapping code (and a couple of other Montage modules) to support off-line interactive science visualization of astronomical images.
Python can be used to construct end-user applications but is at it's finest as an interactive environment for manipulation and analysis. The astroMontage Python package is structured to be used in such a mode, with the user finding an modifying astronomical images, catalogs and image metadata and then constructing and modifying "views" to be presented and updated through mViewer. In this document we will describe basic mViewer use through Python, then expand to more complex views and finally to interaction and integration with other functionality.
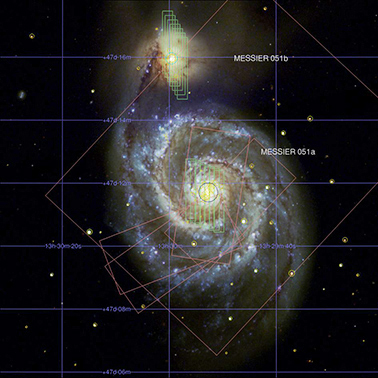
Python session to build a fairly complex mViewer display.
import astroMontage.mViewer as mv

viewer = mv.mViewer()

viewer.set_red_file("SDSS_r.fits")
viewer.set_red_stretch("0.1s", "max", "gaussian-log")

viewer.set_green_file("SDSS_g.fits")
viewer.set_green_stretch("0.1s", "max", "gaussian-log")

viewer.set_blue_file("SDSS_u.fits")
viewer.set_blue_stretch("0.1s", "max", "gaussian-log")

viewer.set_current_color("8080ff")
viewer.add_grid("Equ J2000")

viewer.set_current_color("90ff90")
viewer.add_img_info("mipssed.tbl")

viewer.set_current_color("ff9090")
viewer.add_img_info("irspeakup.tbl")

viewer.set_current_color("ffff00")
viewer.set_current_symbol(1.0, "circle")
viewer.add_catalog("fp_psc.tbl", "j_m", 16, "mag")

viewer.set_current_color("ffffff")
viewer.add_label(202.47083, 47.26614, "Messier 051b")

viewer.set_current_color("000080")
viewer.set_current_symbol(8.0, "circle")
viewer.add_marker(202.49829, 47.26614)

viewer.set_current_color("ffffff")
viewer.add_label(202.41667, 47.21667, "Messier 051a")

viewer.set_current_color("000080")
viewer.set_current_symbol(12.0, "circle")
viewer.add_marker(202.46963, 47.19517)

viewer.init_browser_display()
The following pages will explore the process in more detail.
|
